Team project, Columbia University, August 2026
What Star Ratings Miss: Amazon Beauty Reviews
A multi-method analysis of how customer feedback shapes product success in the online beauty market.
In brief
- The question
- How do customer feedback, expressed preferences and review behavior shape a beauty product's trajectory over time, and what do star ratings alone fail to show?
- The approach
- Five analyses of the Amazon All Beauty reviews dataset, 2015 to 2023: NLP sentiment, clustering, time-series forecasting, association rules and a hybrid recommender.
- The result
- 3.8% of four- and five-star reviews carried negative sentiment, and that mismatch grew as products matured. Clustering surfaced a high-engagement, low-verification segment worth a review-integrity check.
The question
The study uses the Amazon All Beauty dataset compiled by the McAuley Lab at UC San Diego. Its main question is how consumer feedback patterns, expressed preferences and review-based behavior shape product trajectories in the online beauty market over time.
It breaks that into five sub-questions, one per analysis: whether star ratings capture satisfaction or text sentiment reveals hidden dissatisfaction; whether products cluster into distinct market profiles; how satisfaction and review activity shifted between 2015 and 2023; which products are reviewed by the same people; and whether adding review sentiment to a recommender beats ratings alone.
Findings
- Star ratings capture broad satisfaction but miss what shows up in text, timing and co-review behavior.
- 3.8% of four- and five-star reviews carried negative sentiment, and the rating-text mismatch grew from 2.36% to 2.94% as products matured, even though sentiment itself stayed flat.
- Clustering surfaced a small, distinct segment combining high review velocity with a low share of verified purchases. That warrants a review-integrity check, though it cannot by itself establish manipulated reviews.
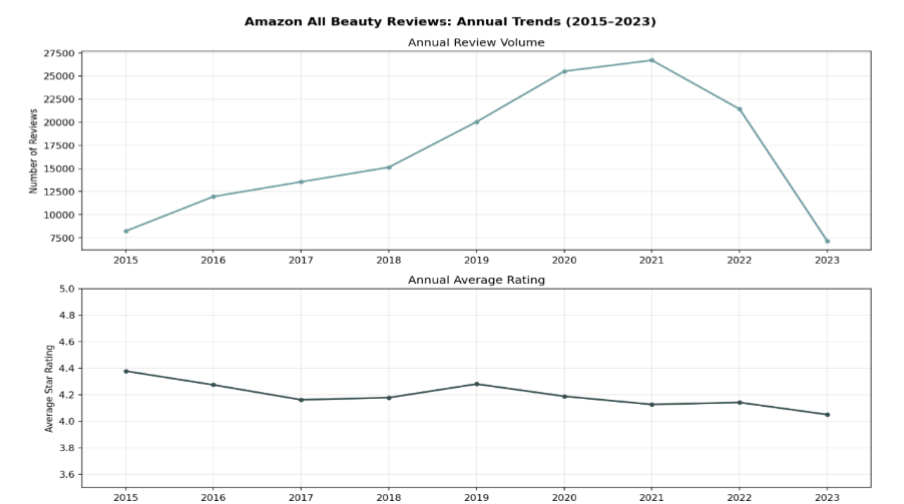
- ARIMA modestly beat the baselines for forecasting average rating but not review volume: satisfaction is more forecastable than engagement.
- Co-review patterns mostly reproduced expected structure rather than new cross-category demand, and adding sentiment to the recommender improved rating accuracy only marginally.
Working with messy data
- The dataset has no purchase or bought-together data, so reviews stood in for purchases in the co-engagement analyses. The report says so.
- The analysis window starts in 2015 for comparability, using the full 2000 to 2023 record only to set that cutoff.
- The granular analyses rest on small samples (806 users for the recommender), and lexicon-based sentiment scoring can misread sarcasm. Both limits are stated.