Coursework, Columbia University
Columbia capstone: data science consulting
Client-style analytics in R: a survey analysis with recommendations, automated reports and a model benchmark.
In brief
- The question
- Where should a phone maker's next marketing dollar go?
- The approach
- Analysis of a survey of 10,000 people about twenty products, delivered as a report, an interactive dashboard and a client presentation.
- The result
- Three recommendations: move awareness budget to the products that already convert well, pause awareness spending on a product with high awareness and low satisfaction, and retarget a product its most engaged shoppers had not heard of.
The setting
The capstone of Columbia's MS in Applied Analytics runs as a simulated consulting firm. Each project ends in something a client could use: a presentation, a report or a tool.
Survey analysis and client presentation
Ten thousand respondents were each asked about all twenty phones in a market. I built a static report, an interactive reporting dashboard in Shiny, and a client presentation organized around one question: where should the next marketing dollar go?
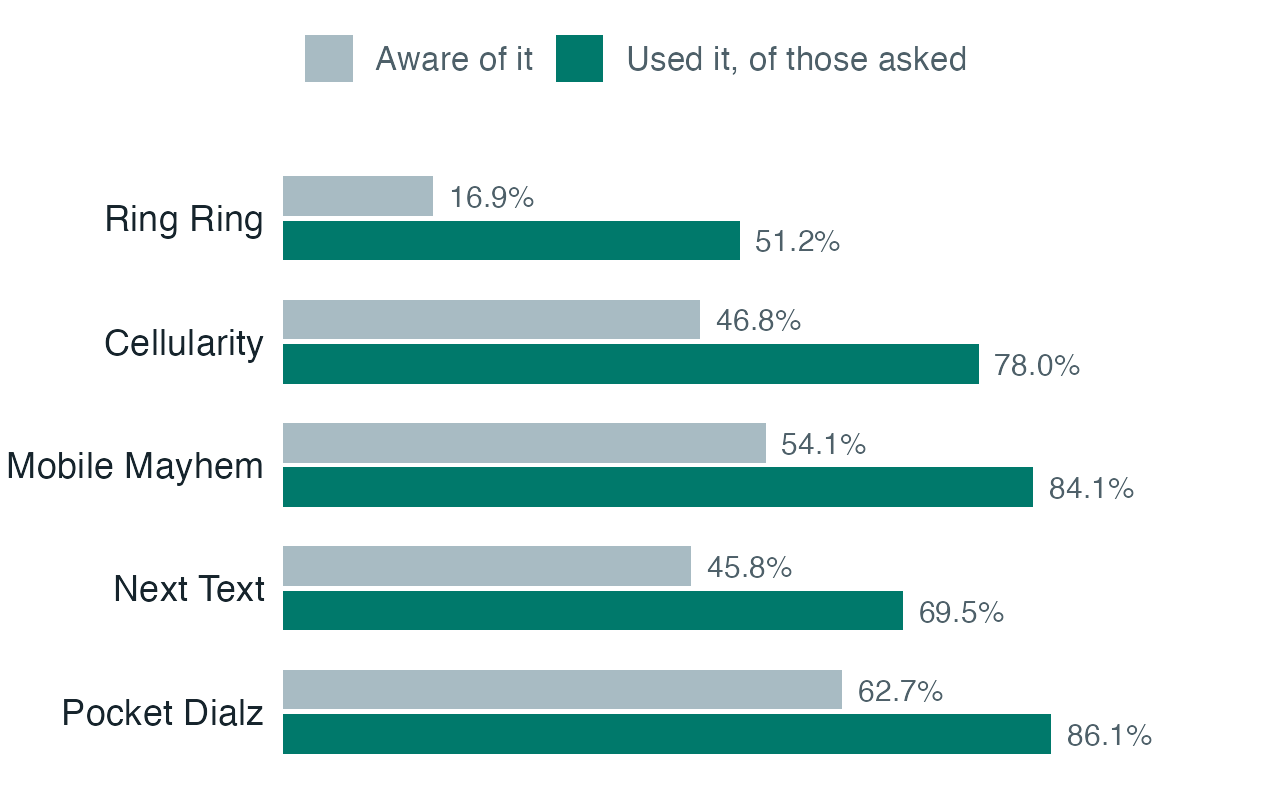
- For five products, usage ran well ahead of awareness. They sell once people find them, so the constraint is awareness, not the product.
- One product had the opposite problem: most of the market knew it, and its customers were not satisfied. More advertising there would pay to introduce new people to a product its current customers are not happy with.
- A model of who knew a third product showed that people who knew many other phones were about half as likely to know it. Its marketing was missing the most engaged shoppers.
- The presentation states the limit of the data before any finding. Nearly everyone answered the awareness questions, but only about thirteen percent of records include a satisfaction score.
Automated monthly reports
A retail transactions report built as a parameterized R Markdown template, with a short generation script for each month. Someone who does not write R changes the month and the file names, runs the script, and gets a self-contained HTML report that opens in a browser without R or an internet connection.
Classifier benchmark
A comparison of five tuned classifiers for recognizing apparel in images: k-nearest neighbors, multinomial logistic regression, random forest, a support vector machine and gradient-boosted trees (XGBoost). The comparison weighs error rate against running time at different training-set sizes.